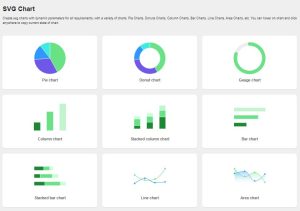
Well, are you excited to know how to generate an online vector-based SVG chart, then you reached the right place! SVG charts and designs are referred to as the best source to represent charts and graphics on sites significantly as they consume less space.
Additionally, one can be able to scale up or down SVG charts while maintaining the original quality of the graphics. When it comes to creating SVG charts, users just have to stick with these below-mentioned SVG generator websites.

It is referred to as a free online SVG chart generator website. Account for this website right now to create both charts and slopes. It provided you with two chart options named block chart and point chart that lets you create an SVG chart swiftly. Once you selected a chart type, you can be able to adjust the chart color, chart points, smoothness, bar radius, and even the chart resolution.
Moreover, you can encounter a refresh option to create variations in the chart. Once you completed a chart, youcould specify the output chart quality (high, low, or normal) and export it in the SVG, JPG, and PNG formats.
-
Simply navigate to this website and choose a chart type from the given chart menu
-
Then, you ought to navigate to the Customize section that lets you specify the chart color, points, resolution, bar radius, and more properties
-
Right after that, you simply have to click on the Refresh button for creating variations in the selected chart type
-
Finally, you just require to specify the chart quality and save it in the SVG vector file format
Copyicon is another expert’schoice SVG chart generator website. It allows users to generate a custom SVG vector chart that is loaded with multiple values and even their remarkable categories. Even it is mainly considered to create a dot SVG chart. If you want to generate custom chars, you simply have to add multiple chart areas and even assign specific colors to them.
Besides that, one could also able to add multiple categories and even assign their coordinate values to attain optimal outcomes. Users allow specifying the chart resolution, chart title, and more elements before finishing the SVG chart. It allows you to export the final chart as PNG, SVG, JPG, PDF, and certain other well-known formats.
-
At first, you have to launch this SVG chart generator website
-
Then, navigate to the chart area, chart categories, chart coordinates, and more elements
-
Now, it’s time to specify the chart resolution
-
At last, simply save your chart as SVG and any other supported formats according to your preference
Account to this SVG chart generator website right now to fetch more about creating vector SVG charts. It allows you to create three different types of SVG charts named Pie Chart, Line Chart, and Bar Chart. You just have to add the Data fields and simply assign a unique color to each indicated data field for creating all three SVG charts.
Apart from that, one can be able to manually adjust the size, pie stroke, and pie donut size. Once you generated SVG charts, you can be able to preview them using its main interface and export them as SVG files.
-
To start, you need to launch this website and open up the cable offer section
-
Then, you ought to add the data fields and even add the data (pie portion size values)
-
Right after that, simply specify the colors of each added data field
-
Finally, you require to adjust the chart dimension and make click on the Export button for saving a selected SVG chart
This is another authorized source that provided you with a dedicated SVG chart generator tool. Give a try to this efficient tool right now to generate a pie chart that consists of up to 10 values. Additionally, this handy tool automatically assigns a unique color to each added value.
It allows you to make a selection to add bolder between pie chart elements before finishing the chart. The steps are too simple for generating an SVG chart with this assistance, let’s find the below steps:
-
Navigate to this official website
-
Then, you have to add the pie chart values into the designated field
-
Very next, you need to preview the pie chart and simply add a border if required
-
Finally, hit the Export to SVG button that lets you locally save the final chart
Start using this online SVG chart generator that allows you to create full-fledged customize SVG vector charts of several types including Column, Line, Area, Scatter, and even Pie. It allows users to enter chart coordinates manually or even import a spreadsheet that consists of chart coordinates.
This authorized source will create and even display the SVG vector chart according to the provided values. Once your generated SVG chart is, it assists you to save it as SVG, PNG, PDF, EPS, and PS file formats.
-
Navigate to this website and stick with its sign-in process
-
Now, add the input coordinates manually or start further to import an SVG chart
-
At last, you can get the preview for the final SVG chart and save it locally in SVG file format
It is referred to as an open-source SVG chart generator site that swiftly generates a wide range of charts that later can be exported as SVG. The most auspicious thing is that it lets you generate Bar charts, Line & Area charts, Circular Charts, Scatter Plots, and more.
Additionally, users can fetch best set of chart examples that can view and even edit to generate perfect SVG vector chart. You can use its Vega Editor section in order to create and even edit an SVG chart.
-
Navigate to its official website and open up examples
-
Then, you ought to choose a chart example to use as a base
-
Very next, all you require to open up the Vega Editor and add new chart values to swiftly customize the chart corresponding to your needs
-
At last, save the final chart as SVG vector format
SVG generator websites-svg pie chart generator-svg chart library-chart svg icon-svg donut chart generator-chart svg free-svg graph example-svg-chart react-svg-chart react-native-15 Best Free Online SVG Chart Generator Websites-How to Make Charts with SVG
MS Office MCQS PDF, Ms-Word Excel Powerpoint MCQS PDF Free Download
How To Earn Money From Tiktok Account & And Withdraw Money Tiktok
300 Microsoft Powerpoint MCQ Questions With Answer-MCQ Questions for Microsoft Powerpoint In PDF
300 MS Excel Microsoft Excel Questions Answers MCQs With Correct Answers
300 Microsoft Word MCQ Questions With Answer-MCQ Questions for Microsoft Word In PDF
How to connect Desktop & Laptop PC and Transfer Files Between a Desktop & Laptop PC
The Best Online Bachelor’s in Information Technology Degree Programs

Leave a Reply